
Key takeaways
- Viscosity and foam set the principle: overflow for thin liquids, servo piston for viscous or particulate products, bottom-up for foam.
- A planning figure of 80% OEE turns 80 theoretical BPM from eight heads into roughly 64 realistic BPM.
- Five modeled cases show gains from 8 BPM to about 55 BPM after recipes replaced manual setup.
- Changeover loss can run about $317,500 a year at a 90-minute switch, versus approximately $72,000 at a 20-minute switch
Quick Answer: Which Liquid Filling Machine Fits Your Product?
Viscosity and foam decide the filling principle, target BPM divided by realistic output per head decides the head count, and changeover frequency decides whether recipe memory and quick-change parts pay for themselves. Thin liquids suit gravity or overflow filling, viscous or particulate products need a servo piston filler, and foamy formulas need bottom-up filling. Assume an 80% OEE planning figure and round head count up. Check your capper rate before you order a single head. Compare options in our filling machine range before you shortlist.
Use this first-pass map before you open a spreadsheet:
Industry | Typical Bottle and Product | Speed Range (estimated) | Why This Filler Fits |
Cosmetics and personal care | 30 to 200 ml serum, lotion and cream in glass or PET | estimated 40 to 110 BPM | Servo piston for creams, overflow for toner levels |
Food and beverage | 250 ml to 1L juice, dressing, honey and oil | estimated 25 to 60 BPM | Large-bore piston for particulates, overflow for the fill line |
Pharmaceutical | 30 to 100 ml syrup and oral solution | estimated 20 to 55 BPM | Sanitary servo piston, batch records, weight feedback |
Agrochemical and lubricants | 1L to 5L HDPE jugs of oil and concentrate | estimated 12 to 25 BPM | Servo piston, stored recipes per size, net-weight option |
Household chemicals | 500 ml to 1.5L detergent and disinfectant | estimated 30 to 70 BPM | Bottom-up overflow controls surfactant foam |
Industry Applications: What Changes Across Five Verticals
Five verticals, five definitions of a good fill. An industrial liquid filler that wins in cosmetics can fail in agrochemicals for reasons unrelated to nozzle count. A companion article covers what five industries demand from a filling machine in depth.
The failure modes are where the verticals diverge, not the fill principle. Cosmetics fight stringing; pharma fights documentation; detergents fight foam.
Cosmetics and personal care
A 30 ml serum pours like water, while a 200 ml winter cream strings off the nozzle like soft butter. That spread drives the setup: servo piston dosing for creams, overflow filling for thin toners where the shelf level must match. Modeled speeds sit at 40 to 110 BPM with four to eight heads, and thick creams take the low end.
Three things go wrong on this line. Viscous cream strings and drips. Thin toner aerates. Pump caps scuff when torque is set for glass but the line is running PET.
Target ±0.5% to ±1% dosing, but treat torque repeatability as the tighter spec. A bottle that leaks in a carton costs more than a half point of giveaway (product over target fill).
Food and beverage
Now add particles and washdown. Dressings with visible seeds and honey need larger valve bores and contact parts that clean quickly between recipes. An assumed 25 to 60 BPM is normal for 250 ml to 1L containers. Large-bore piston filling handles particulates, overflow holds the level line in clear bottles, and gravity still works for thin oils.
Seeds bridge at the valve seat. Foam shifts the level mark. Sugar dries under the nozzles. Design for ±0.8% on particulates, 304 or 316 contact parts, and nozzles that come off without tools.
Quick disassembly saves more hours than an extra pair of heads.
Pharmaceutical
The product is still easy to move, but the documentation is not. Oral syrups and tinctures at 30 to 100 ml run at a nominal 20 to 55 BPM because batch release and weight checks slow the effective rate. Servo piston dosing or peristaltic pumping with 316L contact parts is common, and in-line checkweighing with feedback closes the loop.
Three things get a syrup line shut down: cross-batch residue, underfill risk, and a seal that passes the fill check but fails integrity later. Aim for ±0.4% to ±0.5% accuracy and keep batch records, torque logs and cleaning validation. Buyers here are graded on traceability. Speed is secondary.
Agrochemical and lubricants
The container gets bigger and the dose heavier. One line may see 1L, 4L and 5L HDPE jugs of oil or herbicide concentrate. A four-head servo piston filler runs at a nominal 12 to 25 BPM, faster on 1L and slower on 5L. One fixed curve will overfill the large jug and underfill the small one unless recipes are stored separately.
Density drift with temperature is another source of giveaway, so net-weight metering can earn its cost. Flammable concentrates may need explosion-proof electrics.
Target ±0.5% and specify PTFE or PVDF seals for corrosives. Set torque high enough to seal without deforming the neck. Profitability turns on changeover time. Fill time is already short enough.
Household chemicals and detergents
Surfactant foam decides the nozzle design on a detergent line. Dropping product from the top whips air into a 500 ml to 1.5L bottle, and the level mark drifts. The operator slows the line.
Wet necks get rejected at the capper. Rework eats the margin. Nominal speeds run 30 to 70 BPM with bottom-up overflow nozzles for detergents and sanitizers, and piston dosing for gels.
Drip-return nozzles and nozzle travel matter more than cycle speed. Hold ±0.8% to ±1% level consistency with chemical-resistant seals. For detail, see why foamy products overflow a filling machine before you specify a nozzle.
Industry | Viscosity band | Fill method | Typical fill volume | Estimated speed | Critical failure mode |
Cosmetics and personal care | Thin to very thick | Servo piston, overflow | about 30 to 200 ml | estimated 40 to 110 BPM | Stringing, drip and torque scuffing |
Food and beverage | Thin to particulate | Large-bore piston, overflow, gravity | about 250 ml to 1L | estimated 25 to 60 BPM | Valve bridging and foam level drift |
Pharmaceutical | Low to medium | Servo piston, peristaltic | about 30 to 100 ml | estimated 20 to 55 BPM | Cross-batch residue and underfill risk |
Agrochemical and lubricants | Medium to high | Servo piston, net weight | about 1L to 5L | estimated 12 to 25 BPM | One fixed curve across three jug sizes |
Household chemicals | Low to gel | Bottom-up overflow, piston | about 500 ml to 1.5L | estimated 30 to 70 BPM | Foam carryover and dirty necks |
Customer Case Studies: Five Lines Before and After
In each case, the constraint was not where the plant expected it to be. Every number is an estimated composite example, so read the pattern, not the decimal.
Cosmetics, Turkey: From Three Heads to Six
At a plant near Izmir, three semi-automatic tabletop heads filled 50, 100 and 200 ml serums and lotions into glass and PET. Output was a modeled 8 BPM at ±2.5% deviation, with four operators on filling. Seasonal reformulation was the breaking point: a light serum to a thick winter cream meant new nozzles and about two hours of recalibration.
The plant installed a six-head servo piston liquid filling machine with a heated hopper, stored recipes and torque-controlled capping. That automatic liquid filling line reached 55 BPM at ±0.5% with one operator, and changeover fell to about 20 minutes. Estimated payback came at 13 months, mostly from labor and less overfill of high-value serum.
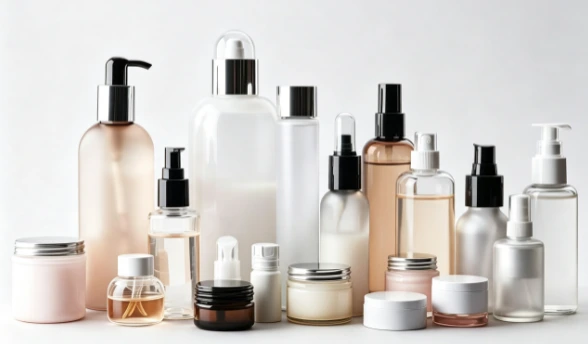
Servo piston heads handling a 50 to 200 ml cosmetics range, estimated 55 BPM.
Food and beverage, Mexico: Seeds at the Valve
Seeds bridged at the valve seat twice a shift at a dressing producer outside Guadalajara. The plant filled 250 and 500 ml glass bottles with visible seeds on a gravity filler at a modeled 15 BPM. Operators scraped the tank about twice per shift and cleared blocked valves repeatedly.
The fill line wandered from bottle to bottle. The line moved to an eight-head servo piston filler with larger bores, particulate-safe nozzles and a rotating hopper brush. After: 42 BPM at ±0.8%, overfill down by about 1.8 percentage points, and one operator. Estimated payback came at 11 months.
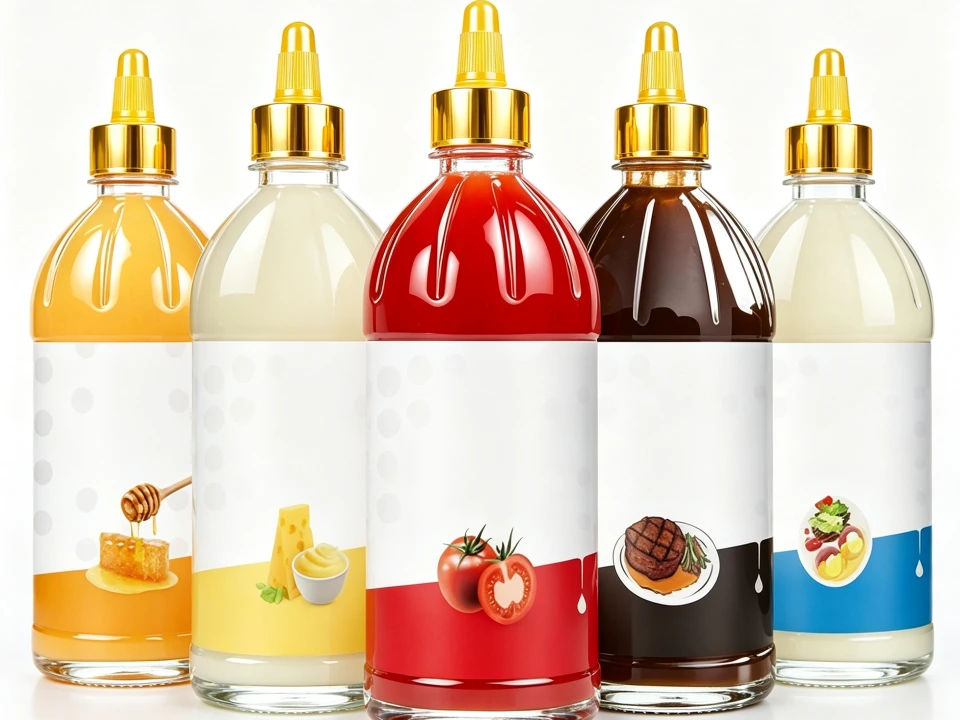
Particulate-safe nozzles on a dressing line, estimated 42 BPM.
Pharmaceutical, India: Batch Records on the Line
Underfill and seal rejects were costing an oral syrup maker near Pune an estimated 2.1% of output. The plant ran 30, 60 and 100 ml products at a modeled 20 BPM with ±2% deviation. Manual batch setup and weight checks consumed the shift. The problem was traceability as much as speed.
The plant added an eight-head servo piston filler with 316L contact parts, in-line checkweighing with feedback and recipe-based batch records. After: 48 BPM at ±0.4%, rejection below 0.2%, and full electronic batch trails. Estimated payback came at 15 months once documentation labor was counted.
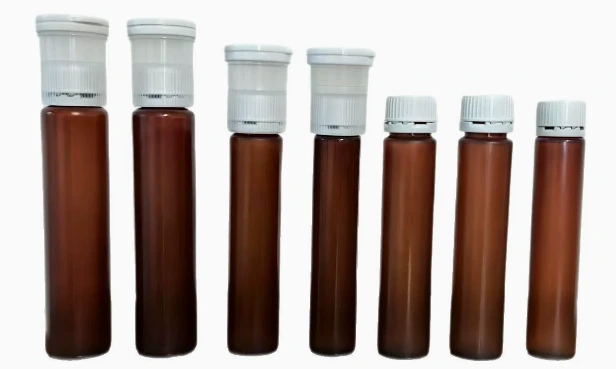
Sanitary servo filling with weight feedback, estimated ±0.4% accuracy.
Agrochemical and lubricants, Brazil: Three Jugs, One Line
A lubricant packer near São Paulo ran 1L, 4L and 5L HDPE jugs at a modeled 12 BPM. Changing size took about two hours and two operators, and one fixed fill curve overfilled the 5L jug while underfilling the 1L. Four servo piston heads, three stored recipes and quick-change guides replaced the setup.
After: a sustained 13.3 BPM, about 800 containers per hour, at ±0.5%, with changeover down to about 15 minutes. Estimated payback came at 12 months.
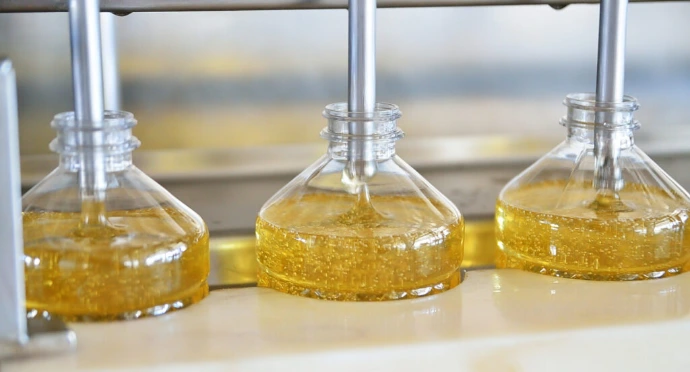
One line serving three jug sizes through stored recipes.
Household chemicals, Indonesia: Foam at the Neck
A 3% rework rate at a detergent plant near Jakarta traced back to foam at the neck. The plant filled 500 ml and 1L HDPE bottles at a modeled 25 BPM. Top-down filling aerated the surfactant blend and the level drifted. Wet necks drew the rework.
The fix was a six-head overflow filler with bottom-up nozzle travel and drip-return suction. After: 50 BPM at ±1% level consistency and rework down to 0.4%. Estimated payback came at 10 months. Nozzle motion did more than extra heads here.
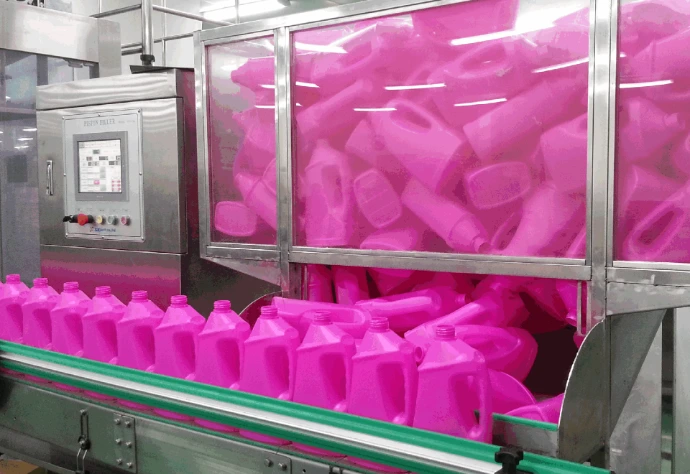
Bottom-up overflow fill controls foam on surfactant products.
Industry | Region | Before (BPM, accuracy, labor) | After (BPM, accuracy, labor) | Changeover | Payback (estimated) |
Cosmetics | Turkey | estimated 8 BPM, estimated ±2.5%, an estimated 4 operators | estimated 55 BPM, estimated ±0.5%, 1 operator | about 120 minutes to about 20 minutes | estimated 13 months |
Food and beverage | Mexico | estimated 15 BPM, estimated ±0.8% level, 1 operator | estimated 42 BPM, estimated ±0.8%, 1 operator | blocked valves cleared by hand | estimated 11 months |
Pharmaceutical | India | estimated 20 BPM, estimated ±2%, manual batch setup | estimated 48 BPM, estimated ±0.4%, electronic records | recipe-based setup | estimated 15 months |
Agrochemical and lubricants | Brazil | estimated 12 BPM, fixed curve, an estimated 2 operators | estimated 13.3 BPM, estimated ±0.5%, 1 operator | about 120 minutes to about 15 minutes | estimated 12 months |
Household chemicals | Indonesia | estimated 25 BPM, estimated 3% rework, 1 operator | estimated 50 BPM, estimated ±1% level, 1 operator | bottom-up nozzle recipe | estimated 10 months |
All five cases are estimated composite examples. They illustrate mechanisms and orders of magnitude, not audited customer results.
How Many Filling Heads Do You Need? Sizing Formula and Data Table
Most mistakes come from dividing your target by a brochure number. A multi-head filling machine is easier to size from cycle time than from a catalog rating. Use this sequence:
- Theoretical BPM = nozzle count × cycles per minute.
- Cycle time = indexing (the index motion between fills) + nozzle dive + fill time + drip or anti-foam delay.
- Single-head theoretical capacity = 60 ÷ cycle time in seconds.
- Realistic BPM per head = theoretical BPM per head × OEE. Use an 80% OEE planning figure as the default.
- Required filling heads = target BPM ÷ realistic BPM per head. Round up, then add one head if viscosity varies or changeovers are frequent.
- Sanity check: confirm the capper and labeler good-bottle rate meets or exceeds the filler's realistic BPM.
Worked example A, the planning case. An eight-head machine at 10 cycles per minute gives 80 theoretical BPM, about 4,800 bottles per hour. At an 80% OEE planning figure, that becomes roughly 64 BPM, about 3,840 BPH.
A plant targeting about 2,000 bottles per day on one eight-hour shift needs roughly 4.2 BPM averaged across the shift. Four heads are generous here. Bottle handling and changeover decide the outcome. Eight heads add cost without adding throughput.
Worked example B, the catalog trap. Assume six seconds of indexing, three seconds of nozzle dive and six seconds of fill. That is a 15-second cycle, about 4 cycles per minute, and 32 BPM from eight heads.
That is how an 80 BPM catalog figure can halve on a working line. The number was accurate on paper. It assumed a cycle the line cannot run.
Assumptions for the table below: 10 cycles per minute, an 80% OEE planning figure, 500 ml free-flowing product and one eight-hour shift. These are modeled inputs for planning.
Filling heads | Theoretical BPM | Realistic BPM at estimated 80% OEE | Realistic BPH | Suggested line scale |
2 | 20 | 16 | about 960 | Pilot, small batch, under an estimated 8,000 bottles per day |
4 | 40 | 32 | about 1,920 | Startup to small plant, an estimated 8,000 to 25,000 per day |
6 | 60 | 48 | about 2,880 | Growing regional line, an estimated 25,000 to 45,000 per day |
8 | 80 | 64 | about 3,840 | Mid-volume multi-SKU, an estimated 45,000 to 70,000 per day |
12 | 120 | 96 | about 5,760 | High-volume plant, an estimated 70,000 to 110,000 per day |
16 | 160 | 128 | about 7,680 | Large line or parallel SKUs, an estimated 110,000 or more per day |
24 | 240 | 192 | about 11,520 | Industrial beverage or chemical line |
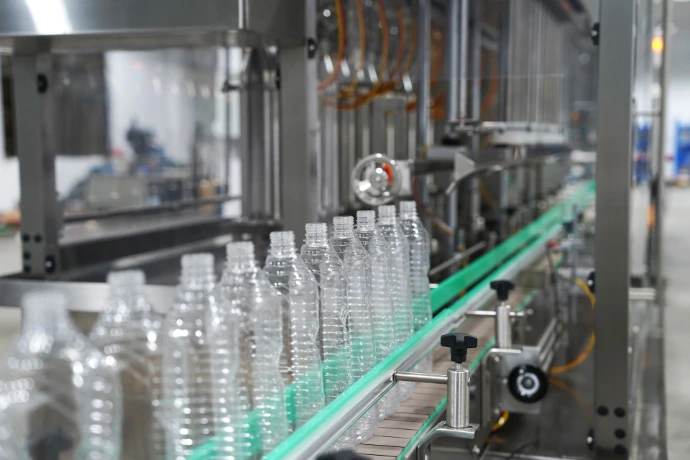
Honey, thick cream and 5L oil need longer fill time. At the same head count, expect a 30% to 50% BPM loss. Test with your own sample rather than water.
Have a target BPM? Ask for an estimated head-count calculation using your own cycle times.
Changeover Economics: What Multi-SKU Switches Really Cost
Changeover is the cost line most RFQs ignore. Use this formula per switch:
Annual changeover loss = annual switches × [(downtime hours × line BPH × margin per bottle) + (technicians × hourly rate × downtime hours) + (average purge scrap cost)]
Use a planning case: 60 realistic BPM (about 3,600 BPH), a $0.10 modeled margin per bottle, and two switches per shift across 250 shifts. That is roughly 500 switches a year. All figures below are estimated.
At 90 minutes per switch, lost margin runs about $540 (1.5 × 3,600 × $0.10), approximately $270,000 a year. Two technicians at $25 per hour add about $75 per switch, approximately $37,500 a year. Scrap at $20 per switch adds about $10,000 a year. Total: approximately $317,500 a year.
At 20 minutes with quick-change guides, the line loses about $60,000 in margin, about $8,000 in labor and about $4,000 in scrap, approximately $72,000 total. The saving of about $245,000 against a $150,000 to $200,000 upgrade puts payback under one year.
Cost bucket | Old process (estimated 90 minutes) | Quick-change process (estimated 20 minutes) | Annual difference (estimated) |
Lost margin | about $540 per switch, about $270,000 per year | about $120 per switch, about $60,000 per year | about $210,000 saved |
Technician labor | about $75 per switch, about $37,500 per year | about $17 per switch, about $8,000 per year | about $29,500 saved |
Purge scrap | about $20 per switch, about $10,000 per year | about $8 per switch, about $4,000 per year | about $6,000 saved |
Ranges vary by machine type. Typical changeover windows:
- Quick-change inline fillers: 10 to 30 minutes to swap nozzles and recall a recipe.
- Tool-free rotary lines: 30 to 90 minutes.
- A full turret insert: 2 to 4 hours, then from a few hours to a full day for CIP and verification.
Plants with several SKUs commonly lose an estimated 25% to 30% of planned time to changeover.
If the capper is the real constraint on your line, read what to specify before buying a filling and capping machine before you approve a filler upgrade.
When a Liquid Filling Machine Is the Wrong Choice
Not every line needs a new filler. Five rules of thumb save money:
- One SKU at very high volume with no changeover: a dedicated monoblock may beat a flexible multi-head machine on cost per bottle.
- Extreme shear sensitivity or aseptic product: you may need aseptic or isolator technology, not a faster piston filler.
- Fewer than an estimated 20 changeovers a year: quick-change tooling rarely repays its cost. Spend on fill accuracy instead.
- Unstable thin-wall bottles: invest in star wheels (the bottle-handling wheels) and feed rails first. A better filler cannot fix a container that tips at 60 BPM.
- The capper sets the rate: adding filling heads only builds a bigger buffer table. Buy capping heads first, then revisit the filler.
Time your slowest station over a full shift, then buy the station that sets your line rate.
RFQ Checklist: What to Send a Filling Machine Supplier
Send the same data to every supplier for comparable quotes. Include these 10 data points:
- Bottle drawings and neck finish specifications, including closure type.
- Product viscosity and density at fill temperature, plus whether particulates are present.
- Fill volume range and target accuracy, stated as a percentage or a mass tolerance.
- Target sustained BPM and the OEE assumption used to reach it.
- SKU count and changeovers per year.
- Preferred filling principle, or a request for a recommendation based on samples.
- Contact-part materials and cleaning method, CIP or quick disassembly.
- Rated speeds of upstream and downstream equipment, especially the capper and labeler.
- Site utilities: voltage, frequency, compressed air and available floor space.
- FAT (factory acceptance test) acceptance criteria and sample product for a witnessed fill test.
Then ship samples. A supplier who runs your bottles and formula can quote a modeled cycle time and a defensible head count. One who quotes from a catalog gives you a brochure number.
Getting a Line Recommendation
The right liquid filling machine matches your viscosity, your changeover rhythm and the true bottleneck, not the biggest brochure number. Bring your bottle drawings, a product sample and a target output. We will estimate head count, cycle time and changeover cost, and return a line suggestion within 24 hours. To start, send us your sample and target output for a line recommendation.